
I’m continuing to explore and create new parkrun stats and charts for myself.
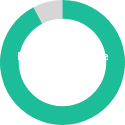
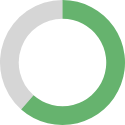
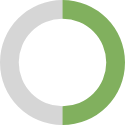
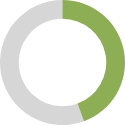
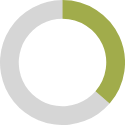
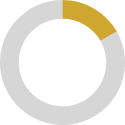
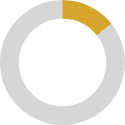
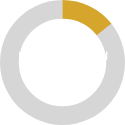
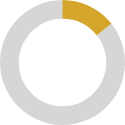
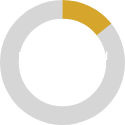
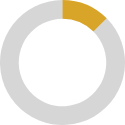
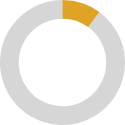
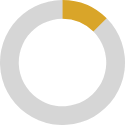
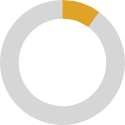
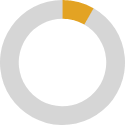
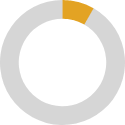
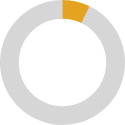
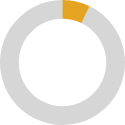
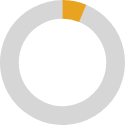
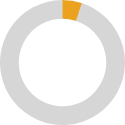
My latest project was to make some Apple Fitness style ‘rings’ that quantify how much of each UK County I have completed in parkrun.
The charts are built in plotly. I write some Python to save them and copy them over to my hugo blog static/ folder. And then I wrote a hugo shortcode to automate looping over my files, finding the donut charts and rendering them inside some <divs>, and leveraging some styling (CSS flexbox mainly) to make them all align and space out nicely.
I think it has worked out quite nicely!
The main thing on my mind now is I need a way of automatically updating this data once a week. So I might need to learn how to schedule these scripts. I’ve previously tried doing something like that using a raspberry pi, but I got stuck when for some reason the pi couldn’t go to a later version of Python. Perhaps I need to re-look at that 🤔