What is debugging?
Debugging is the process of removing errors from your code. The term actually comes from a computer programmer Grace Hopper who found an actual moth stuck in a component of the computer. And so some would say this is the origin of the term ‘bugs’ and ‘debugging’.
How do you debug?
Debugging a generalised term. How debugging is actually done depends on the problem at hand?
Sometimes, you might debug by just writing out some print or log statements and you can see that a variable is changing in a way you don’t expect or desire.
Or take a non-computer related example, if you take a bike and find the brakes aren’t working, to solve the issue you are essentially ‘debugging’. You isolate certain components of your bike, you say okay let’s look at the brake pads on the wheel are they making contact, okay when i pull the brake handle, is it actually moving the wire component?
What is a debugger?
A debugger is a dedicated tool for aiding the process of debugging. It has functionality that makes the process of tracking certain components, variables, stopping at certain points, which all serve to make debugging quicker and easier.
Today I will be sharing an overview of how debugging in VS Code works.
Installing the debugger
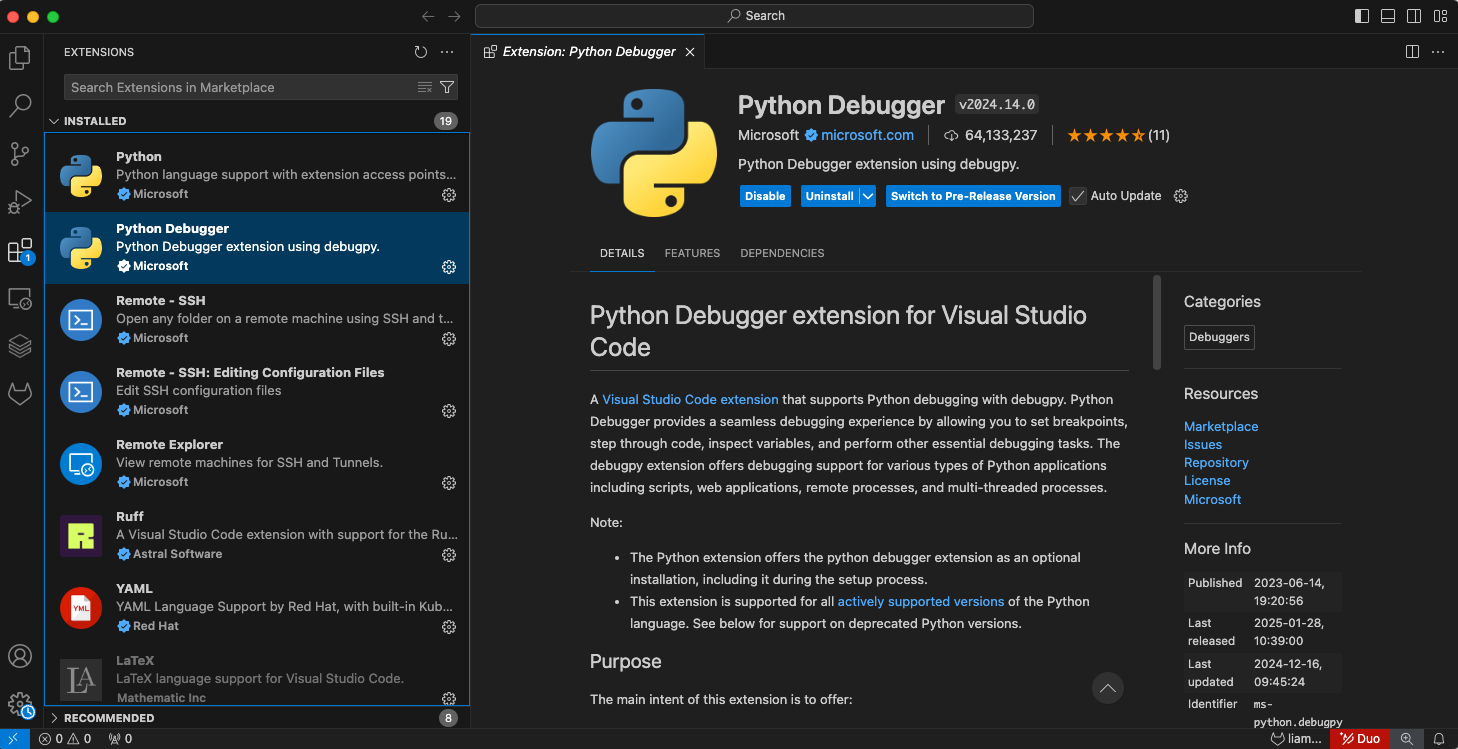
When you open VS Code, you have the option to install extensions. These are plugins that give you extra functionality in your IDE. There is one called Python Debugger . Take a look and make sure you have that installed.
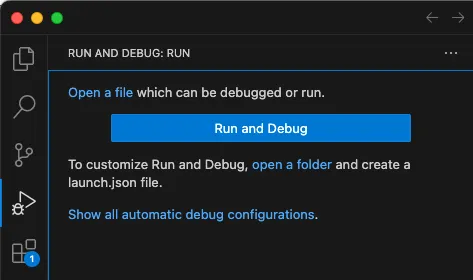
Once that is installed, you will have a Run and Debug extension tab on your left.
Setting Breakpoints
The most important feature of a debugger is that it allows you to set breakpoints. These are specific points in your code in which when you are running in debug mode, the program will stop execution and allow you to interact with the state at that point.
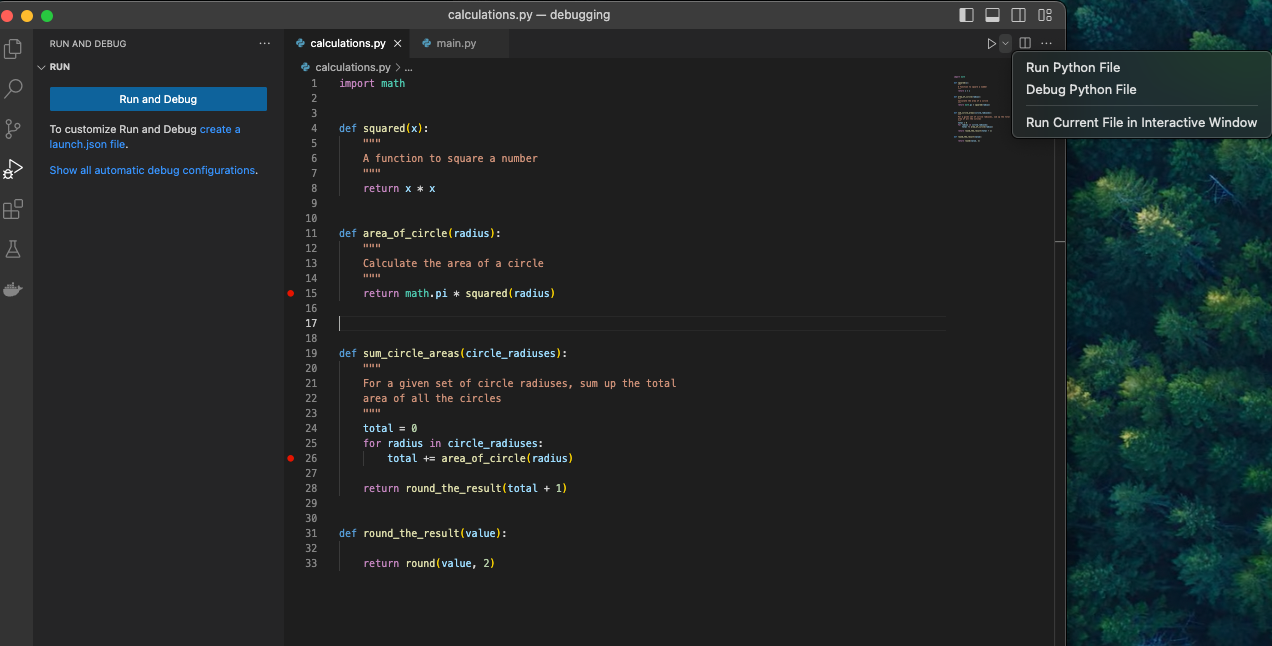
To set a breakpoint in VS Code, the easiest way is to hover to the left of the line of code you want to stop at, and a red marker will appear. When you click that, it sets a breakpoint.
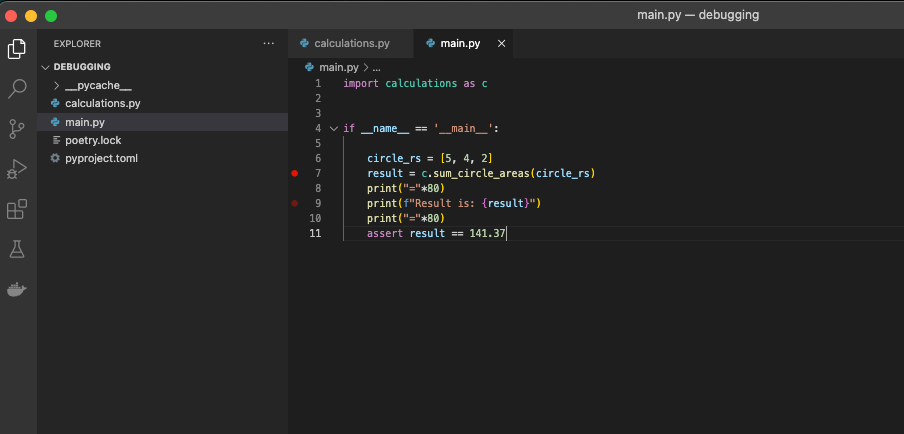
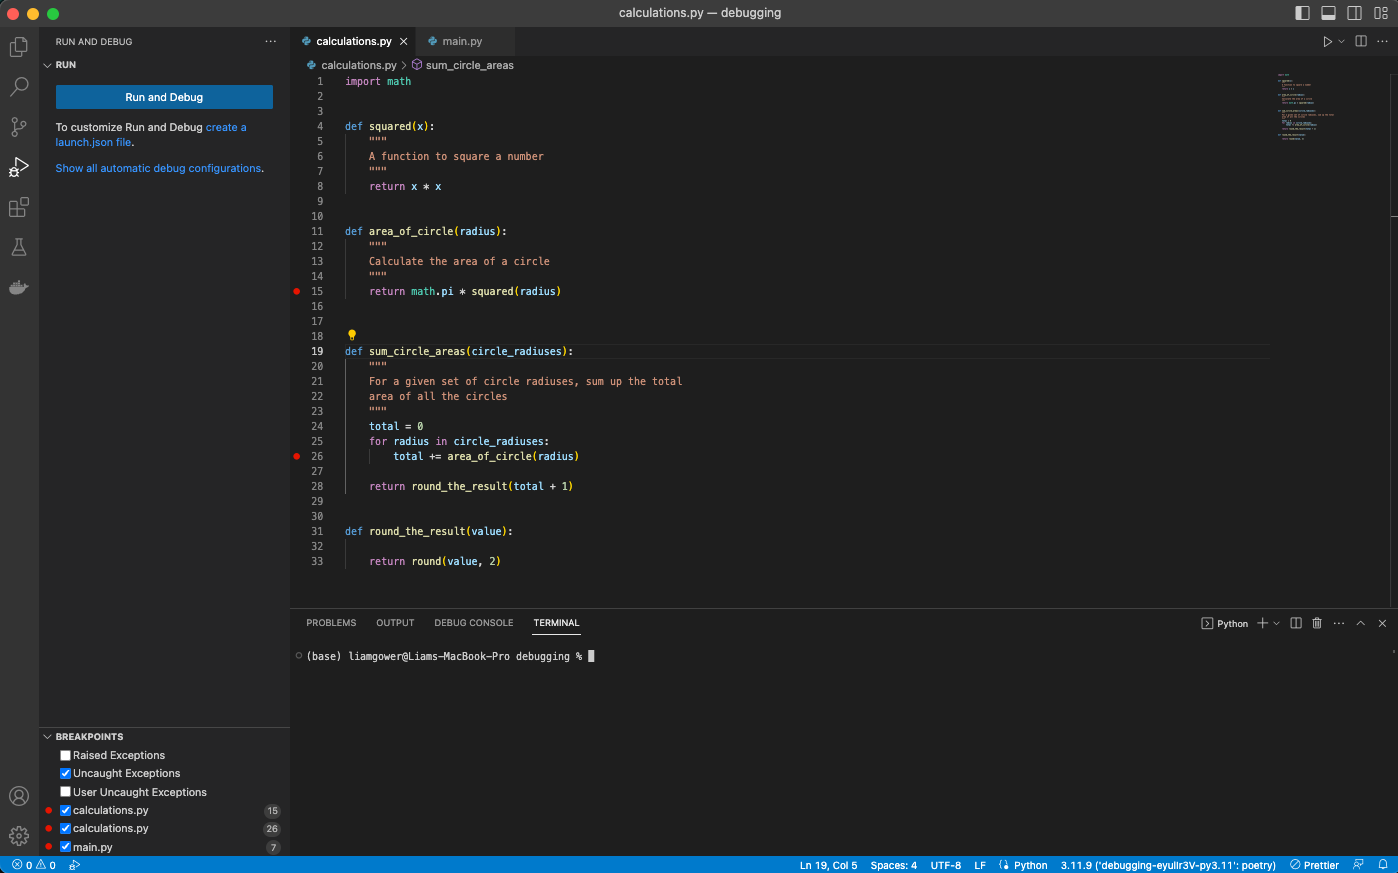
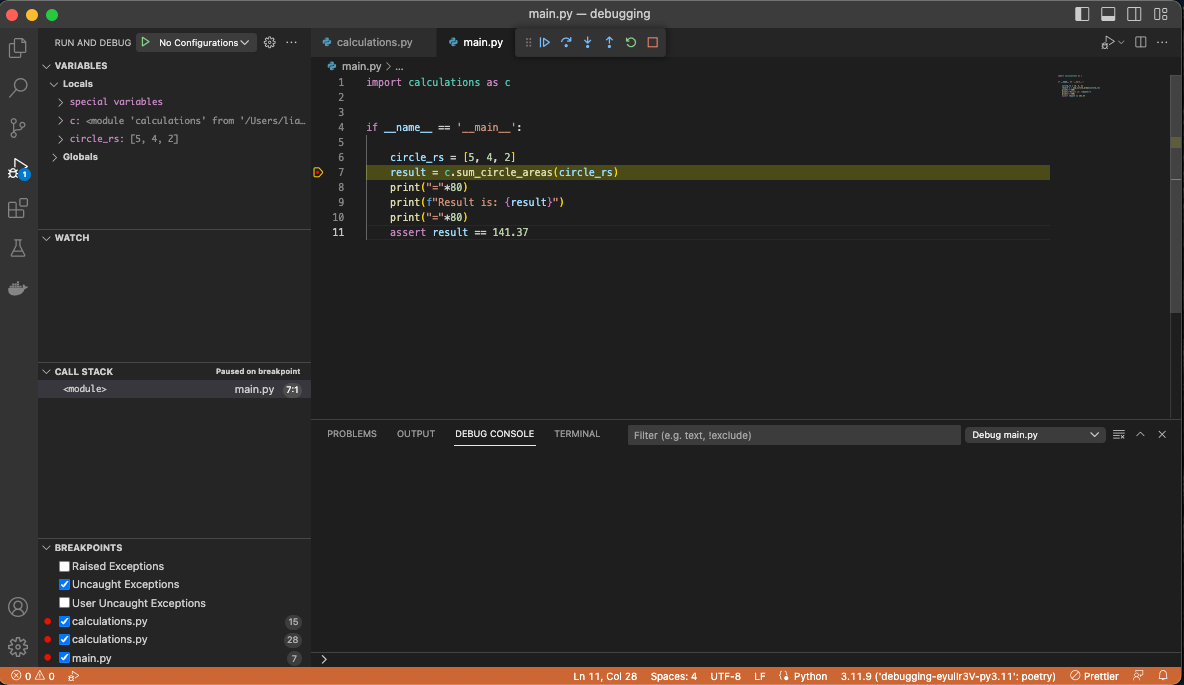
You can also get a view of all of your breakpoints in the bottom left of your VS Code interface. Here you can see I have 1 breakpoint set in line 7 of main.py and 2 breakpoints set in line 15 and 26 of calculations.py.
Running the Debugger
You can run the debugger via a couple of different ways, but the most obvious one would be the play button in the top right corner of VS Code.
This is pretty much the same as when you execute a normal program, except as discussed your program will stop at the breakpoints you have set.
So once I hit that, the debugger runs and as you can see it has stopped at my first breakpoint of line 7 in main.py.
Observe in the top left of the picture below, you now have 3 notable sub-windows: variables, watch and call stack. I will cover each of these in turn.
Variables
The variables pane shows you all the variables that are currently held in memory by the program, at this specific point of execution. In our example we have:
circle_rs: the list of cirle radiuses which was declared earlier in the program on line 6.c: this is showing us that the modulecalculations.pyhas been imported so we have all the module’s functions and variables available to usspecial variables: this is always present and contains things like built-in variables, functions as well as interpreter and debugger state information. It’s not something I’ve personally ever had use out of. But worth knowing about.
Call Stack
The Call Stack shows us the path that the program took to get to the current line of code. Take the example pictured below for example.
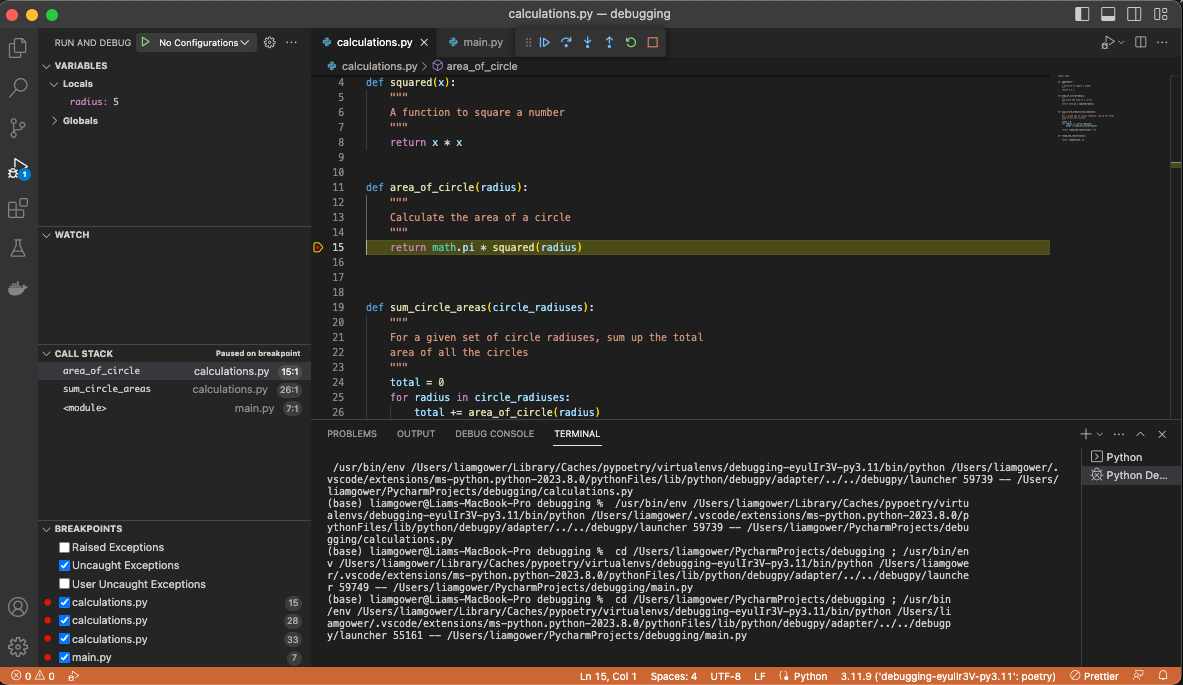
I ran in debug mode main.py and it has stopped at line 15 of calculations.py. When you inspect the
call stack, you can see the order of execution that occured.
- The entire module of
main.pywas called - That called
calculations.sum_circle_areas() - That called
calculations.area_of_circle() - Which lead to us reaching
line 15where our debugger has hit a breakpoint
This is powerful because it enables us to trace back the path of the program calls, understand what variables and values were present at the time of each function call.