This article is an extension of Debugging 101. It covers a few bits that I don’t think are essential for a beginner to know about, but are worth knowing about for more intermediate debuggers.
Conditional Breakpoints
The VS Code debugger allows you to set conditional breakpoints. In other words, you are able to set a breakpoint that will only activate if a certain criteria is met.
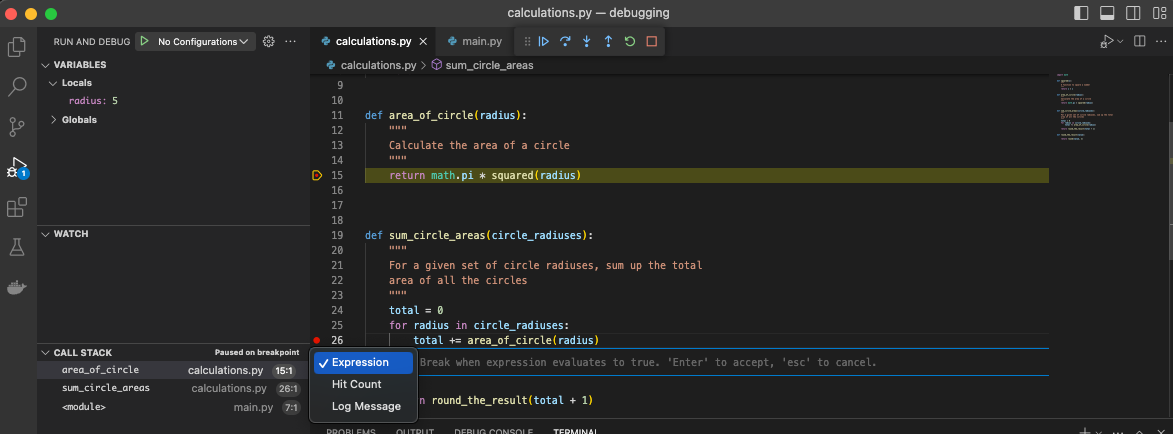
To set one up, right-click on the breakpoint red dot and hit ’edit breakpoint’ and you are presented with the below:

There are 3 built-in conditional types, I will cover each of them in turn.
1. Expression
You can write any expression you like, and if it evaluates to True then the breakpoint is activated.
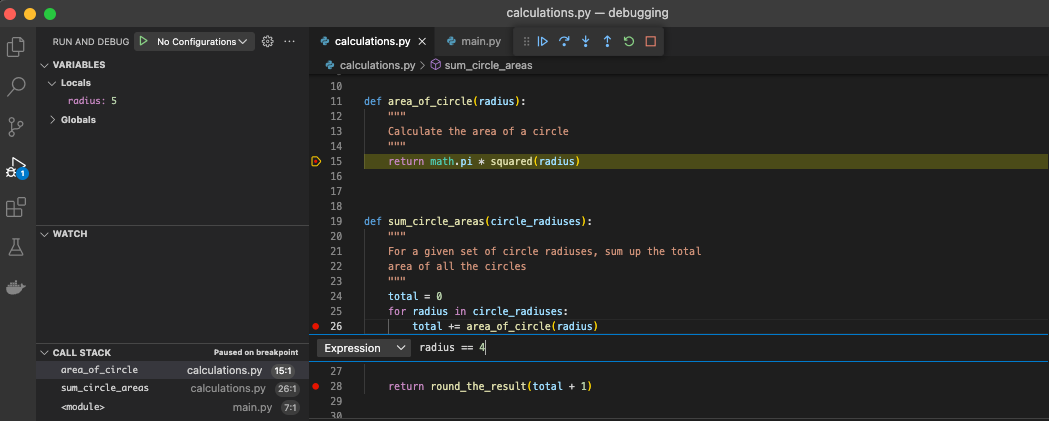
In the example below for example, I only want the breakpoint to activate if radius == 4. Perhaps because I think my program has an issue handling the value 4.
This is particularly valuable then, because this breakpoint is inside a loop. If I didn’t have a conditional breakpoint, my program would stop on every iteration of this loop.

2. Hit Count
The second type of conditional breakpoint is Hit Count. This means you can activate a breakpoint once it has been “hit” (or called) a specified number of times.
In our example, I have set the hit count to be 3 inside the for loop.
When I ran the debugger, it continued all the way until we reached the 3rd iteration of the for loop. I can infer that because I know it loops through the List circle_radiuses, and can see that the radius is 2 - the 3rd item in the list.

This conditional breakpoint is thus useful if perhaps you aren’t expecting a line of code to be called multiple times, or perhaps you suspect it is causing an issue on a specific iteration.
3. Log Message
The third type of conditional breakpoint is Log Message. This enables you to write debug log messages every time the breakpoint is reached.
In our example, I am writing a log message and printing out the value of radius at the time of the breakpoint. This value is interpolated by using the f-string syntax (i.e. putting variables inside curly bracket: {}).

When I then run the debugger, I will now see in the Debug Window my breakpoint log message.

So this is another useful way of keeping track of variables, when breakpoints get hit and so on.
An aside - I’ve personally never used this. I feel like this is the same as writing in my code something like logger.debug(f"blah blah {radius}"). I suppose using the downside is you are adding lines of code to your files that you won’t necessarily want to commit / keep, whereas using the debugger log message, you keep it separate. I would be interested to hear people’s thoughts on this one.
But anyway, now you know about all 3 of VS Code’s conditional debugger breakpoint options!